3. snATAC-seq#
Source: https://muon-tutorials.readthedocs.io/en/latest/single-cell-rna-atac/pbmc10k/2-Chromatin-Accessibility-Processing.html
import warnings
warnings.filterwarnings("ignore")
import numpy as np
# import rapids_singlecell as rsc
import scanpy as sc
import seaborn as sns
# %pip install torch torchvision torchaudio --index-url https://download.pytorch.org/whl/cu124
import torch
import os
import pandas as pd
import scbiot as scb
from scbiot.utils import set_seed

from umap import UMAP
# %pip install scib-metrics
from scib_metrics.benchmark import Benchmarker, BioConservation, BatchCorrection

set_seed(42)

from pathlib import Path
dir = Path(os.environ.get("SCBIOT_EXAMPLES_PATH", Path.cwd()))
print(dir)
parent_dir = dir.parent
print(parent_dir)
scbiot version 1.1.8
Random seed set as 42
/home/figo/software/python_libs/scbiot/examples
/home/figo/software/python_libs/scbiot
%matplotlib inline

sc.set_figure_params(figsize=(6, 6), frameon=False)
sns.set_theme()

%config InlineBackend.print_figure_kwargs={"facecolor": "w"}
%config InlineBackend.figure_format="retina"
Load#
Read the large-window ATAC dataset from disk.
adata_path = f"{dir}/inputs/large_atac_windows.h5ad"

adata = sc.read(
    adata_path,
    # backup_url="https://s3-eu-west-1.amazonaws.com/pfigshare-u-files/25721780/large_atac_windows.h5ad?X-Amz-Algorithm=AWS4-HMAC-SHA256&X-Amz-Credential=AKIAIYCQYOYV5JSSROOA/20250525/eu-west-1/s3/aws4_request&X-Amz-Date=20250525T002915Z&X-Amz-Expires=10&X-Amz-SignedHeaders=host&X-Amz-Signature=c9fdeb654282bde8b8bba2729618372bbe2205900005126ab99786b0b765a520",
)
adata
AnnData object with n_obs × n_vars = 84813 × 118723
    obs: 'batchname', 'batchname_all', 'final_cell_label'
    layers: 'counts'
adata.layers['counts'].max()
1.0
Preprocess#
Remove promoter-proximal peaks, select variable features, and compute LSI.
# Usage
adata_top = scb.pp.remove_promoter_proximal_peaks(
    adata,
    f"{dir}/inputs/gencode.vM25.chr_patch_hapl_scaff.annotation.gtf.gz"
)
Removed 26,457 promoter-proximal peaks (2000bp upstream / 500bp downstream). Remaining: 92,266
# Peak selection
scb.pp.find_variable_features(adata_top, batch_key="batchname_all")

# TF-IDF
scb.pp.add_iterative_lsi(adata_top,
                         n_components=31,
                         n_iter=2,
                         topN=50000,
                         per_cluster_union=False,
                         drop_first_component=True,
                         add_key="X_lsi")


# Save back
adata.obsm["X_lsi"] = adata_top.obsm["X_lsi"]
Running Iterative LSI iteration 1 ...
Running Iterative LSI iteration 2 ...
Integrate#
Run ATAC OT integration on LSI features.
#  -------------------- Example usage --------------------
adata, metrics = scb.ot.integrate(
    adata,
    obsm_key="X_lsi",
    batch_key="batchname_all",
    out_key="X_ot"
)
print(metrics)
[baseline] KNN backend=FAISS-GPU mix=1.4976 strain=0.00000
[iter 01] mix=1.596 overlap0=0.630 strain=0.00588 floor~0.660 J=0.064 best_it=1
[iter 02] mix=1.631 overlap0=0.545 strain=0.02546 floor~0.666 J=0.171 best_it=2
[iter 03] mix=1.648 overlap0=0.494 strain=0.02985 floor~0.673 J=0.165 best_it=2
[iter 04] mix=1.651 overlap0=0.489 strain=0.03342 floor~0.679 J=0.156 best_it=2
[iter 05] mix=1.653 overlap0=0.498 strain=0.03355 floor~0.686 J=0.164 best_it=2
[early stop] plateau reached.
[final] it*=2 mix=1.631 overlap0=0.545 strain=0.02546 tw=0.986
[label transfer] skipped; pass label_key to compute alignment metadata
{'mix': 1.6314102536566846, 'overlap0': 0.5449133515357971, 'strain': 0.025458858753964603, 'tw': 0.9858028546207646, 'it': 2}
Visualize#
Compute UMAP for the OT embedding and plot batch/label structure.
# same as above, run neighbors/UMAP for the scBIOT embedding
methods = ["X_lsi", "X_ot"] # "X_lsi",
leiden_methods = [f'{method}_leiden' for method in methods]

for method, leiden_method in zip(methods, leiden_methods):
    sc.pp.neighbors(adata, use_rep=method, metric="cosine")
    sc.tl.umap(adata)
    adata.obsm[f"X_umap_{method}"] = adata.obsm["X_umap"].copy()
    sc.tl.leiden(adata, key_added=leiden_method, resolution=0.8)
import matplotlib.pyplot as plt
import matplotlib as mpl
import scanpy as sc

sc.settings._vector_friendly = True

mpl.rcParams["axes.edgecolor"] = "black"
mpl.rcParams["axes.linewidth"] = 1.0

def force_border(ax):
    ax.set_axis_on()
    ax.set_frame_on(True)
    ax.patch.set_visible(True)
    for side in ax.spines.values():
        side.set_visible(True)
        side.set_color("black")
        side.set_linewidth(1.0)

methods = ["X_lsi", "X_ot"]  # <-- put your two embeddings here
# e.g. ["scBIOT", "harmony"] or ["scBIOT", "baseline"]

fig, axes = plt.subplots(2, 2, figsize=(10.5, 6.5), squeeze=False)

for r, method in enumerate(methods):
    basis = f"X_umap_{method}"
    axL = axes[r, 0]   # left col: batch
    axR = axes[r, 1]   # right col: label

    sc.pl.embedding(
        adata, basis=basis, color="batchname_all",
        frameon=True, ax=axL, show=False,
        legend_loc="right margin", legend_fontsize=8, title=f"{method}"
    )
    axL.set_box_aspect(1)
    axL.set_xlabel("UMAP1"); axL.set_ylabel("UMAP2")
    force_border(axL)

    sc.pl.embedding(
        adata, basis=basis, color="final_cell_label",
        frameon=True, ax=axR, show=False,
        legend_loc="right margin", legend_fontsize=8, title=""
    )
    axR.set_box_aspect(1)
    axR.set_xlabel("UMAP1"); axR.set_ylabel("UMAP2")
    force_border(axR)

plt.tight_layout()
# fig.savefig("umap_2x2.pdf", dpi=300, transparent=True)
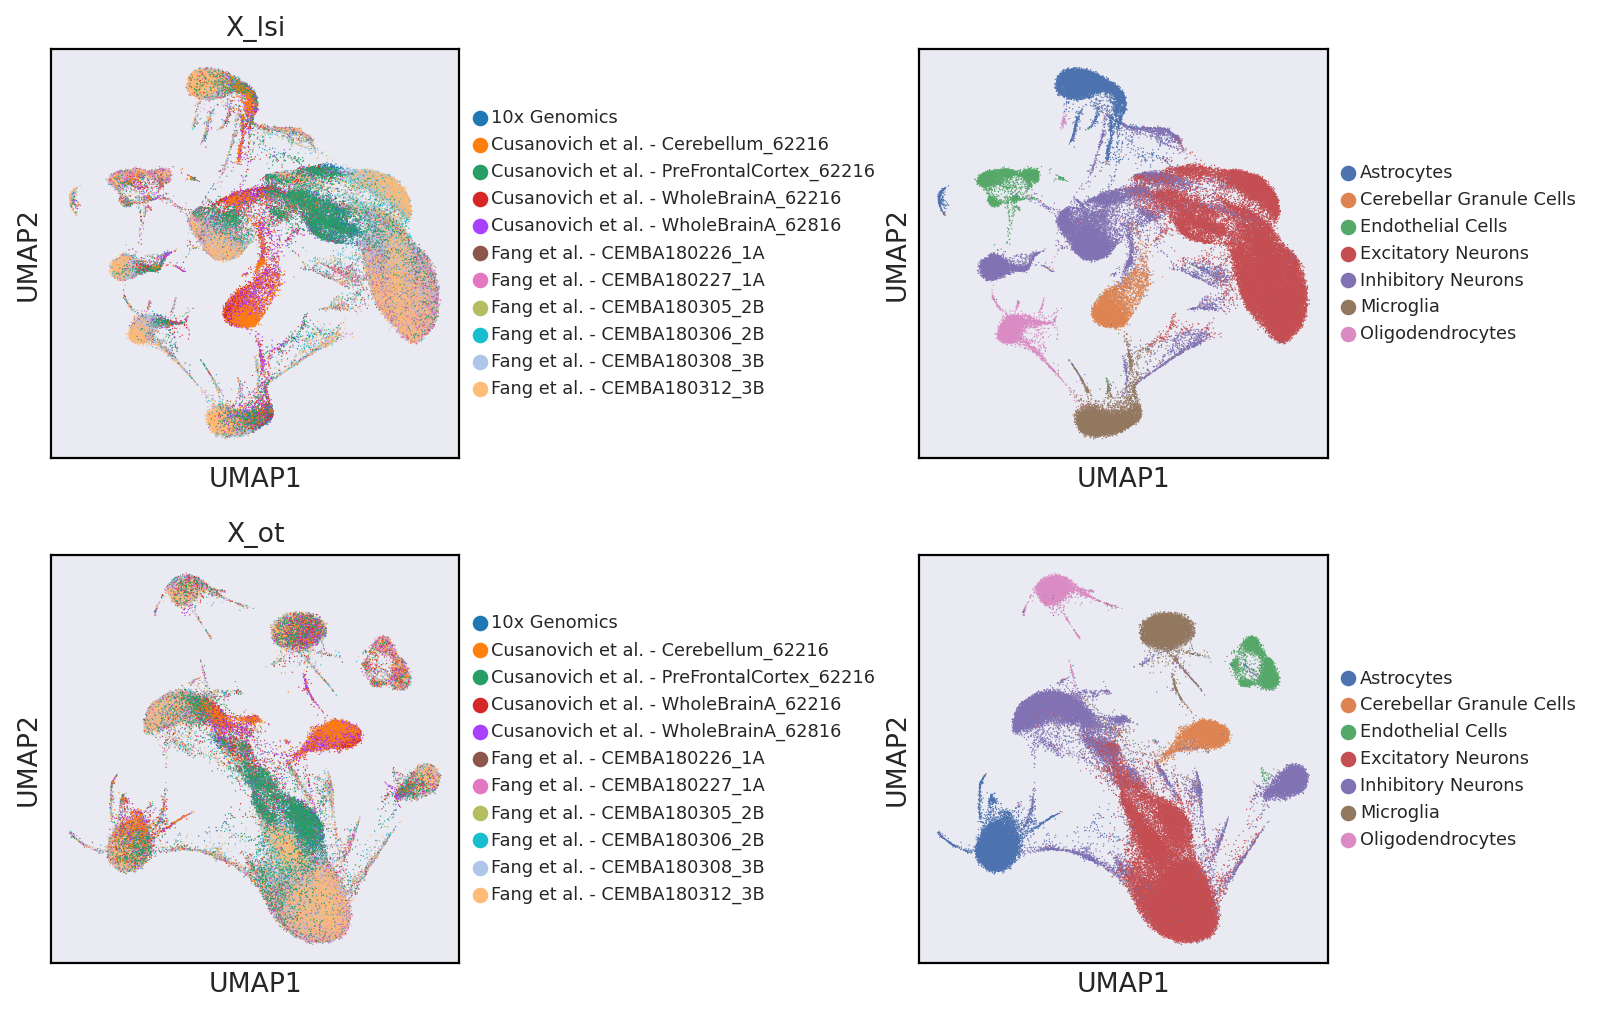
adata.obs['final_cell_label'].value_counts()
final_cell_label
Excitatory Neurons          37000
Inhibitory Neurons          17940
Astrocytes                  10131
Microglia                    7739
Cerebellar Granule Cells     4241
Endothelial Cells            3984
Oligodendrocytes             3778
Name: count, dtype: int64
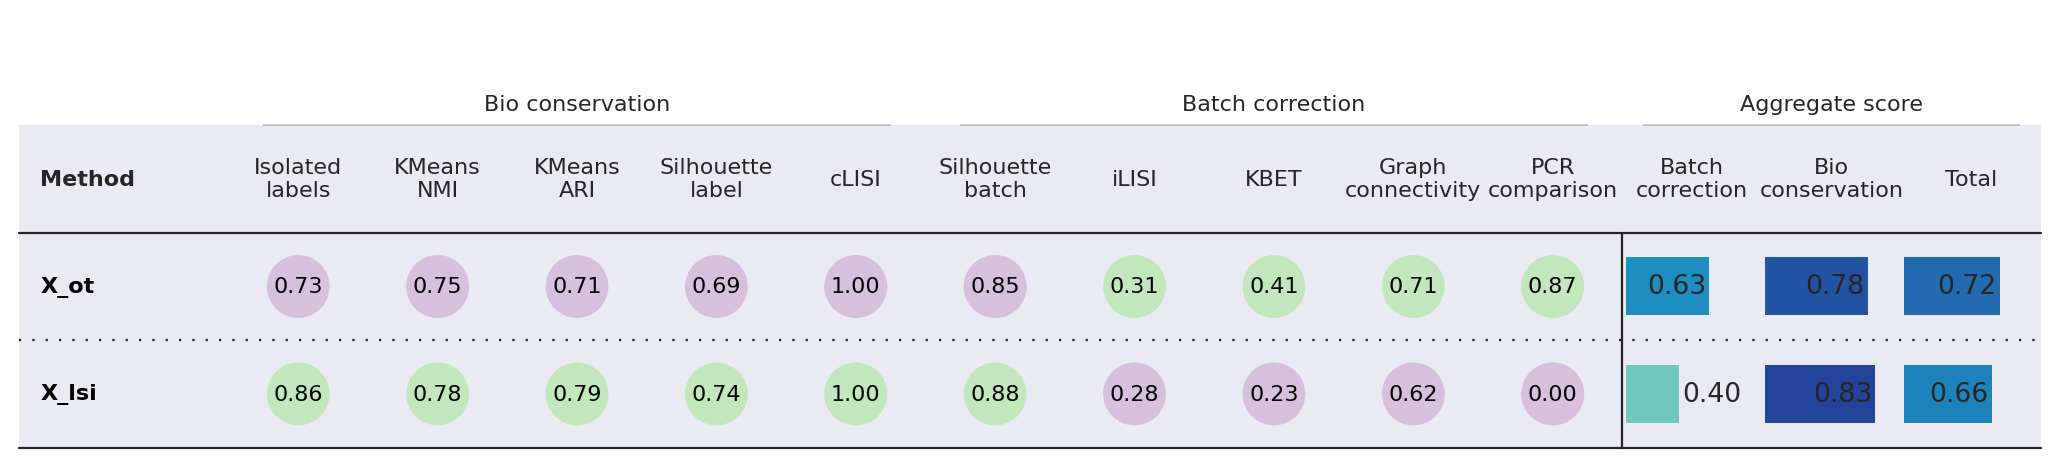
Evaluate (scib-metrics)#
Benchmark X_ot and scBIOT embeddings.
bm = Benchmarker(
    adata,
    batch_key="batchname_all",
    label_key="final_cell_label",
    bio_conservation_metrics=BioConservation(),
    batch_correction_metrics=BatchCorrection(),
    embedding_obsm_keys=["X_lsi", "X_ot"],
    n_jobs=-1

)
bm.benchmark()
Computing neighbors: 100%|██████████| 2/2 [00:09<00:00,  4.65s/it]
Embeddings: 100%|██████████| 2/2 [01:26<00:00, 43.03s/it]
bm.plot_results_table(min_max_scale=False)
<plottable.table.Table at 0x775bb089bb00>