https://scib-metrics.readthedocs.io/en/latest/notebooks/lung_example.html#
import warnings
warnings.filterwarnings("ignore")

import numpy as np
import scanpy as sc
# import rapids_singlecell as rsc
import seaborn as sns
# %pip install torch torchvision torchaudio --index-url https://download.pytorch.org/whl/cu124
import torch
import os
import pandas as pd
import scbiot as scb
from scbiot.utils import set_seed

import harmonypy as hm
from umap import UMAP
# %pip install scib-metrics
from scib_metrics.benchmark import Benchmarker, BioConservation, BatchCorrection

set_seed(42)

from pathlib import Path
dir = Path(os.environ.get("SCBIOT_EXAMPLES_PATH", Path.cwd()))
print(dir)
parent_dir = dir.parent
print(parent_dir)
scbiot version 1.1.7
adata_path = f"{dir}/inputs/lung_atlas.h5ad"

adata = sc.read(
    adata_path,
    backup_url="https://figshare.com/ndownloader/files/24539942",
)
adata
AnnData object with n_obs × n_vars = 32472 × 15148
    obs: 'dataset', 'location', 'nGene', 'nUMI', 'patientGroup', 'percent.mito', 'protocol', 'sanger_type', 'size_factors', 'sampling_method', 'batch', 'cell_type', 'donor'
    layers: 'counts'
adata
AnnData object with n_obs × n_vars = 32472 × 15148
    obs: 'dataset', 'location', 'nGene', 'nUMI', 'patientGroup', 'percent.mito', 'protocol', 'sanger_type', 'size_factors', 'sampling_method', 'batch', 'cell_type', 'donor'
    layers: 'counts'
# sc.pp.normalize_per_cell(adata, counts_per_cell_after=1e4)
# sc.pp.log1p(adata)
# sc.pp.highly_variable_genes(adata, n_top_genes=2000, flavor="cell_ranger", batch_key='batch')
# sc.pp.scale(adata)
# sc.tl.pca(adata, n_comps=50, use_highly_variable=True)

sc.pp.highly_variable_genes(adata, n_top_genes=2000, flavor="seurat_v3", batch_key='batch')
sc.pp.normalize_total(adata)
sc.pp.log1p(adata)
sc.pp.scale(adata)
sc.tl.pca(adata, n_comps=30, use_highly_variable=True)
scBIOT diagnostics#
mix: Average KNN batch-label entropy (how well batches are mixed in local neighborhoods). Higher is better; max is ~
log(n_batches)(not normalized).overlap0: Fraction of shared KNN neighbors between the original embedding (
X0) and the current embedding. Range ~0–1; higher preserves local structure.strain: Mean squared (clipped) relative change in distances on the original KNN graph. Lower is better (less local distortion).
floor: The overlap target used for penalizing low overlap in a given iteration (linearly interpolated between
overlap0_loandoverlap0_hi).J: Composite optimization score used to pick the best iteration:
(mix gain) + w_overlap * overlap0 − w_strain * (strain increase) − overlap penalties.
adata, metrics = scb.ot.integrate(adata,
                                  obsm_key='X_pca',
                                  batch_key='batch',
                                  out_key='X_ot'
                                  )
print(metrics)
[baseline] KNN backend=FAISS-GPU mix=0.5520 strain=0.00000
[iter 01] mix=0.603 overlap0=0.933 strain=0.00050 floor~0.600 J=0.207 best_it=1
[iter 02] mix=0.656 overlap0=0.889 strain=0.00129 floor~0.607 J=0.260 best_it=2
[iter 03] mix=0.708 overlap0=0.845 strain=0.00249 floor~0.614 J=0.303 best_it=3
[iter 04] mix=0.766 overlap0=0.797 strain=0.00388 floor~0.621 J=0.348 best_it=4
[iter 05] mix=0.820 overlap0=0.755 strain=0.00547 floor~0.629 J=0.394 best_it=5
[iter 06] mix=0.876 overlap0=0.714 strain=0.00735 floor~0.636 J=0.441 best_it=6
[iter 07] mix=0.932 overlap0=0.666 strain=0.00965 floor~0.643 J=0.482 best_it=7
[iter 08] mix=0.983 overlap0=0.633 strain=0.01222 floor~0.650 J=0.530 best_it=8
[iter 09] mix=1.032 overlap0=0.598 strain=0.01479 floor~0.657 J=0.563 best_it=9
[iter 10] mix=1.077 overlap0=0.559 strain=0.01784 floor~0.664 J=0.585 best_it=10
[iter 11] mix=1.118 overlap0=0.525 strain=0.02129 floor~0.671 J=0.602 best_it=11
[iter 12] mix=1.159 overlap0=0.499 strain=0.02538 floor~0.679 J=0.621 best_it=12
[iter 13] mix=1.193 overlap0=0.474 strain=0.03118 floor~0.686 J=0.626 best_it=13
[iter 14] mix=1.229 overlap0=0.449 strain=0.03596 floor~0.693 J=0.630 best_it=14
[iter 15] mix=1.258 overlap0=0.425 strain=0.04200 floor~0.700 J=0.626 best_it=14
[final] it*=14 mix=1.229 overlap0=0.449 strain=0.03596 tw=0.980
[label transfer] skipped; pass label_key to compute alignment metadata
{'mix': 1.2285335811899947, 'overlap0': 0.4488266706466675, 'strain': 0.03595890666381806, 'tw': 0.9800251673796428, 'it': 14}
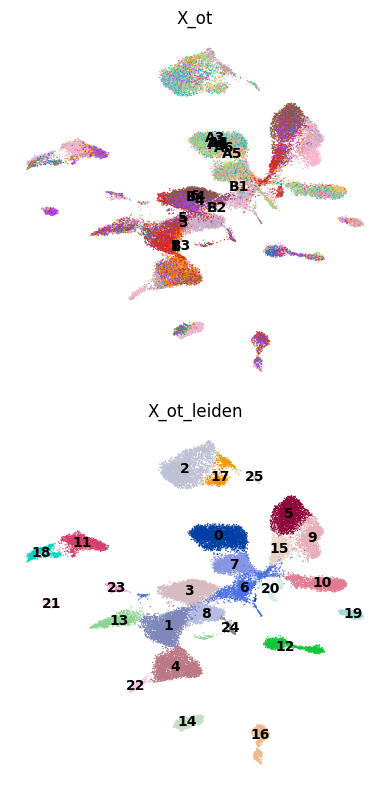
methods = ["X_ot"] # , "scBIOT_OT"
leiden_methods = [f'{method}_leiden' for method in methods]

for method, leiden_method in zip(methods, leiden_methods):
    sc.pp.neighbors(adata, use_rep=method)
    sc.tl.umap(adata)
    adata.obsm[f"X_umap_{method}"] = adata.obsm["X_umap"].copy()
    sc.tl.leiden(adata, key_added=leiden_method, resolution=0.8)
import matplotlib.pyplot as plt
import scanpy as sc


# 2 rows x len(methods) columns
fig, axes = plt.subplots(
    2,
    len(methods),
    figsize=(4 * len(methods), 8),
    squeeze=False  # ensures axes is a 2D array
)

for col, method in enumerate(methods):
    # 1) Top row (row=0): color by "batch"
    sc.pl.embedding(
        adata,
        basis=f"X_umap_{method}",  # The coordinates stored in adata.obsm["X_umap_{method}"]
        color="batch",            # Assume adata.obs["batch"] exists
        frameon=False,
        ax=axes[0, col],
        show=False,
        legend_loc="on data",
        legend_fontsize=10,  # smaller font
        title=f"{method}"
    )

    # 2) Bottom row (row=1): color by the Leiden clusters for this method
    leiden_key = f"{method}_leiden"
    sc.pl.embedding(
        adata,
        basis=f"X_umap_{method}",
        color=leiden_key,         # Column in adata.obs
        frameon=False,
        ax=axes[1, col],
        show=False,
        legend_loc="on data",
        legend_fontsize=10,  # smaller font
        # title=f"{method}"
    )

plt.tight_layout()
# fig.savefig("batch_and_leiden_per_embedding.pdf", dpi=300)
# plt.close(fig)
fix the bug in the scib-metrics#
change _graph_connectivity.py: <mask = labels == label> to <mask = (labels == label).to_numpy()>#
bm = Benchmarker(
    adata,
    batch_key="batch",
    label_key="cell_type",
    bio_conservation_metrics=BioConservation(),
    batch_correction_metrics=BatchCorrection(),
    embedding_obsm_keys=["X_pca", "X_ot"], # ,"scBIOT"
    n_jobs=-1

)
bm.benchmark()
Computing neighbors: 100%|██████████| 2/2 [00:02<00:00,  1.19s/it]
Embeddings: 100%|██████████| 2/2 [00:24<00:00, 12.43s/it]
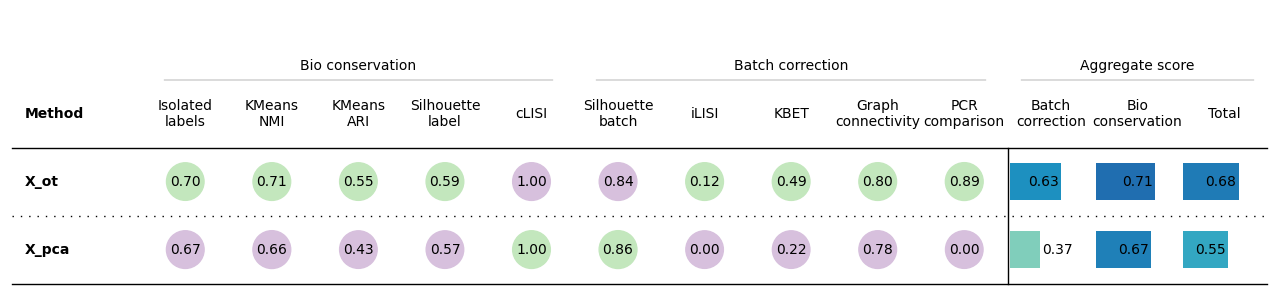
bm.plot_results_table(min_max_scale=False)
<plottable.table.Table at 0x7336d4243f80>
import pandas as pd

df = bm._results.copy()

# Make it robust to either index=metric_name or a column called "Embedding"
if "Embedding" in df.columns:
    df = df.set_index("Embedding")

# Normalize column name
if "Metric Type" in df.columns:
    df = df.rename(columns={"Metric Type": "metric_type"})

# Identify embedding columns (everything except metric_type)
emb_cols = [c for c in df.columns if c != "metric_type"]

bio = df[df["metric_type"].str.contains("bio", case=False, na=False)]
batch = df[df["metric_type"].str.contains("batch", case=False, na=False)]

rows = []
for emb in emb_cols:
    bio_mean = bio[emb].mean()
    batch_mean = batch[emb].mean()
    score = 0.6 * bio_mean + 0.4 * batch_mean
    rows.append(
        {"embedding": emb, "bio_mean": bio_mean, "batch_mean": batch_mean, "score": score}
    )

out = (
    pd.DataFrame(rows)
    .set_index("embedding")
    .sort_values("score", ascending=False)
)

print(out.round(6))
           bio_mean  batch_mean     score
embedding
X_ot       0.710677    0.627331  0.677339
X_pca      0.666171    0.373153  0.548963